How to use NVIDIA Visual Profiler to profile Python scripts containging GPU code?
If you're looking to optimize your Python scripts using GPU acceleration and gain insights into their performance, it's essential to visualize GPU profiling data. In this guide, I'll show you how to achieve this using NVIDIA tools on a system with Compute Capability 8.0 or higher, like your ASUS laptop with an RTX 3050 Ti GPU (Compute Capability 8.6).
My System:
- OS: Windows 11
- GPU: NVIDIA RTX 3050 Ti
- Compute Capability: 8.6
Command Prompt Profiling
First, let's explore command-line GPU profiling using NVIDIA Nsight Compute CLI (ncu). This tool is designed to analyze GPU activities.
- Ensure that you have Nsight Systems installed and that your GPU supports Compute Capability 8.0 or higher.
- Open a command prompt with administrative privileges.
- Use the following command to profile your Python script:
-
Here, replace "python" with the full path to your "python.exe", and replace "my-python-script.py" with the full-path to your Python script for example, I executed the following command in the command prompt:
ncu "C:\Users\siddh\anaconda3\envs\fmri_python_env\python.exe" "D:\code\cupy-custom-kernel.py" - Ncu will detect the NVIDIA GPU activities and provide detailed insights, as shown in the screenshot below.
ncu python my-python-script.py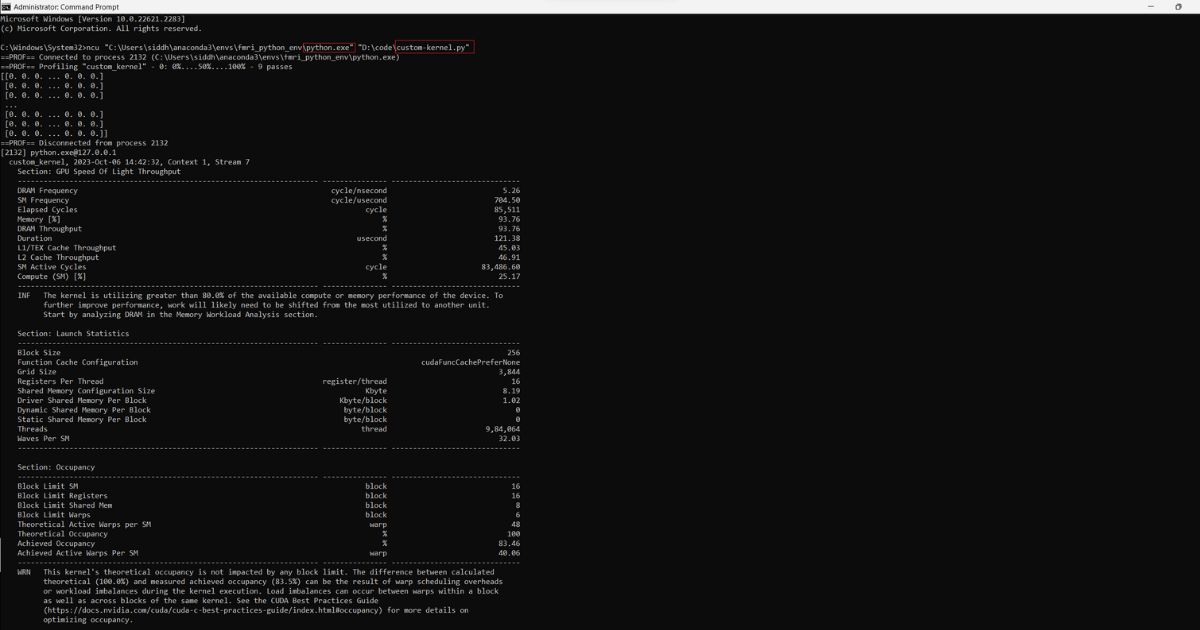
Graphical Profiling
For a more visually intuitive approach, you can use NVIDIA Nsight Systems to visualize GPU profiling results. Follow these steps:
- Locate the nsys.exe tool on your system. Typically, it can be found in (Mind! your version of Nsight):
- Use the following command to generate a profiling output file:
-
As mentioned above, replace "python" with the Python executable's full path and
"python_script_to_profile.py" with the full path of the Python script to profile, for example, I executed the following command:
nsys profile -o "D:\code\gpu-profiling-results\cupy\addition" "C:\Users\siddh\anaconda3\envs\fmri_python_env\python.exe" "D:\code\custom-kernel".py - The above command will create a file named "addition.nsys-rep", which contains GPU profiling data.
- Now, you can load this file into NVIDIA Nsight Systems to view graphical profiles and gain insights into your Python script's GPU performance.
C:\Program Files\NVIDIA Corporation\Nsight Systems 2022.4.2\target-windows-x64nsys profile -o my_profiling_output python python_script_to_profile.pySample Python Program & its Profiling:
Aim of the Program
Our program does the following:
- Creates and combines images of circles using the powerful CuPy library for GPU acceleration.
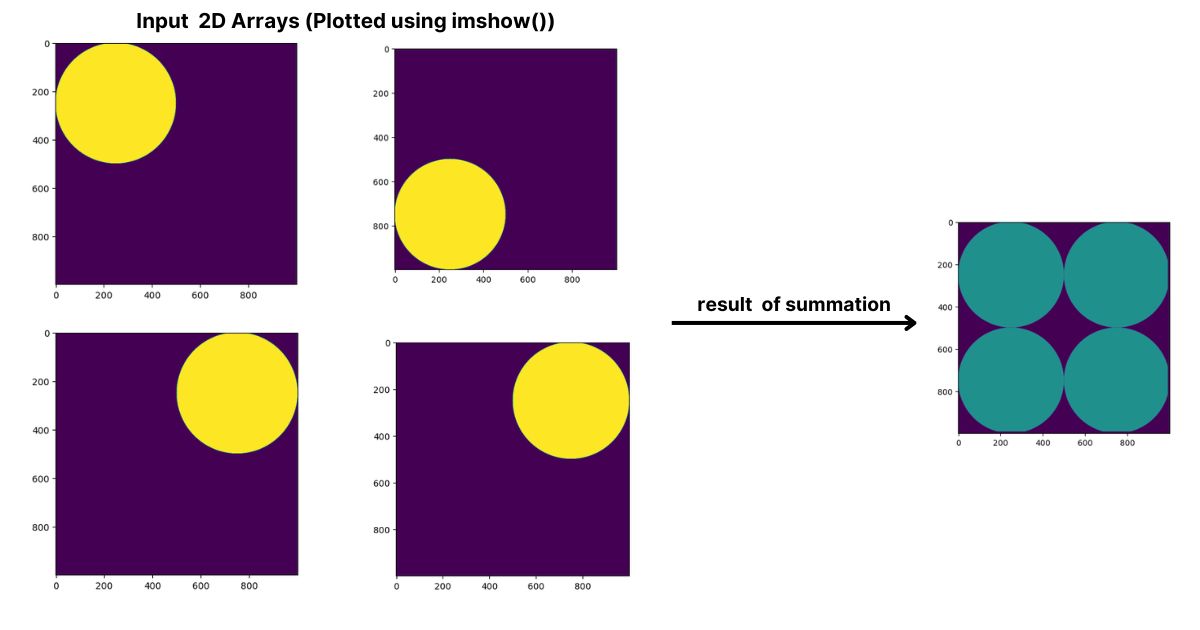
- Creates four 1000x1000 images, each containing a circle with a radius of 250 and centers at different locations within the image.
- Transfers these images to the GPU using CuPy.
- Defines a custom kernel to sum the four images on the GPU.
- Performs the image summation on the GPU.
- Transfers the result back to the CPU.
Why CuPy?
CuPy is a GPU-accelerated library that provides an easy way to perform numerical operations on the GPU using a syntax similar to NumPy. This makes it an excellent choice for tasks that benefit from GPU parallelism, such as image processing and scientific computing.
Results
The final result is an image that combines the four circles into one. You can further process or visualize this image as needed.
Code
Here's a snippet of the Python code used for this program:
import cupy as cp
import numpy as np
import matplotlib.pyplot as plt

# Function to create a dummy image of a circle with specified center and radius
def create_circle_image(size, center, radius):
    image = np.zeros(size, dtype=np.float32)
    for x in range(size[0]):
        for y in range(size[1]):
            if (x - center[0]) ** 2 + (y - center[1]) ** 2 <= radius ** 2:
                image[x, y] = 1.0
    return image

# Create four circle images
image1 = create_circle_image((1000, 1000), (250, 250), 250)
image2 = create_circle_image((1000, 1000), (750, 250), 250)
image3 = create_circle_image((1000, 1000), (250, 750), 250)
image4 = create_circle_image((1000, 1000), (750, 750), 250)

# Transfer the images to the GPU
gpu_image1 = cp.asarray(image1)
gpu_image2 = cp.asarray(image2)
gpu_image3 = cp.asarray(image3)
gpu_image4 = cp.asarray(image4)

# Create a custom kernel using raw_kernel
custom_kernel = cp.RawKernel(r'''
extern "C" __global__
void custom_kernel(float* a, float* b, float* c, float* d, float* result, int width, int height)
{
    int x = threadIdx.x + blockIdx.x * blockDim.x;
    int y = threadIdx.y + blockIdx.y * blockDim.y;

    if (x < width && y < height)
    {
        int idx = y * width + x;
        result[idx] = a[idx] + b[idx] + c[idx] + d[idx];
    }
}
''', 'custom_kernel')

# Create an empty array on the GPU to store the result
result_image = cp.zeros((1000, 1000), dtype=cp.float32)

# Define grid and block dimensions
block_dim = (16, 16)
grid_dim = (result_image.shape[0] // block_dim[0], result_image.shape[1] // block_dim[1])

# Call the custom kernel to sum the images
custom_kernel(grid_dim, block_dim, (gpu_image1, gpu_image2, gpu_image3, gpu_image4, result_image, result_image.shape[0], result_image.shape[1]))

# Transfer the result back to the CPU
result_image_cpu = cp.asnumpy(result_image)

# Print or process the result as needed
print(result_image_cpu)
Profiling above code:
As explained above, generate ".nsys-rep" file using nsys.exe and then load the file in NVIDIA Nsight Systems to visualize the execution of your GPU code.
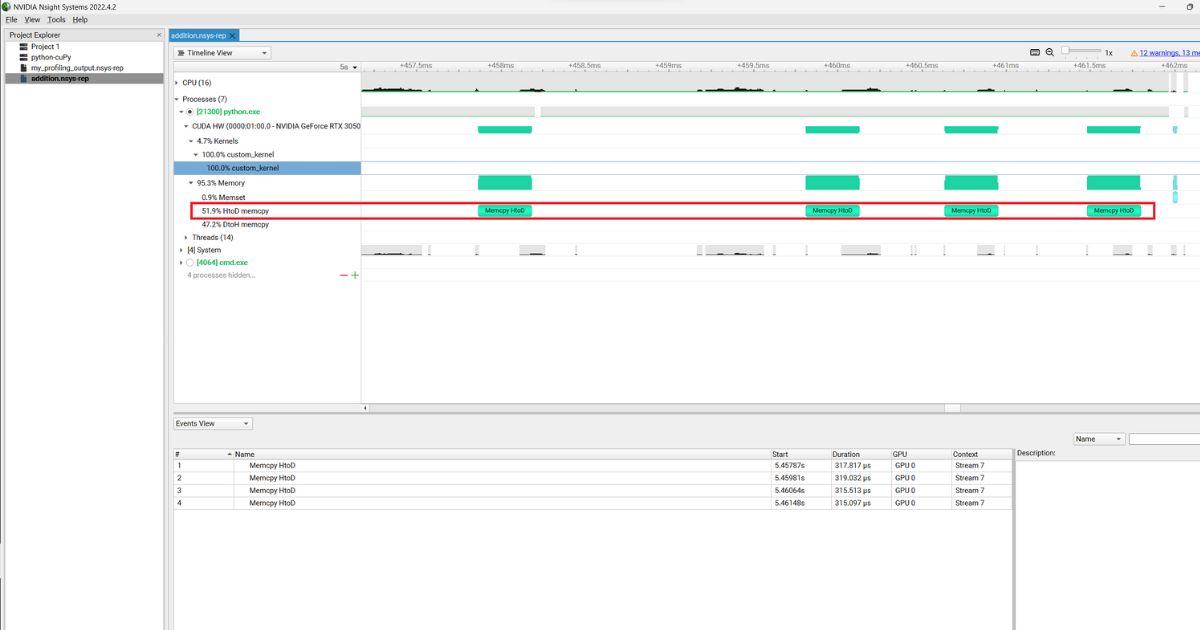
In the screenshot above, we can see the profiling results of our python script containing a custom CUDA kernel. In our program, we created four images on host side (i.e. CPU) and tranferred them to the the device (i.e. GPU). We can see those four memory transfer events (HToD memory) in the NVIDIA's profile. Similary, you can find a lot more information about your program in the profiler.
Disclaimer: The opinions expressed in this blog are my own. If you have any discrepancies or suggestions for improvements, please feel free to contact me. Your feedback is highly valued.